top of page
Lesson 3
Box Plots


In the above pictures, students are using spaghetti noodles to learn how to construct box plots. They broke the noodles into 12 distinct lengths and arranged them from shortest to longest. Students found the five-number summary of the noodle lengths and made their first box plot!
Student Samples
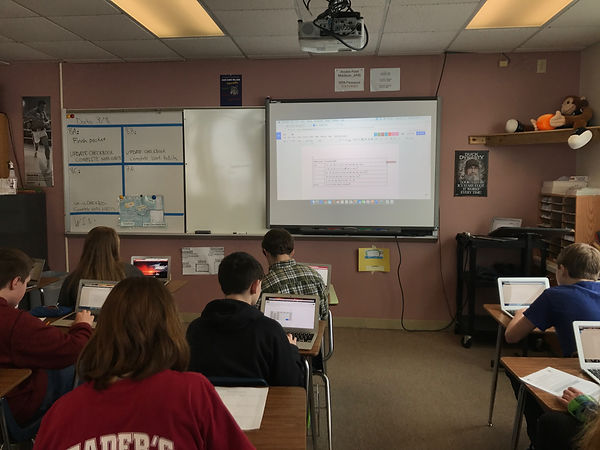
In these pictures, students are "bottle flipping" to collect data. Students calculated their success rate at 6 different levels. Students used a Google doc to share their results and each student constructed a bar graph and a box plot from the class' data.
bottom of page